The diagram plugin
Description
This plugins integrates flot (diagrams in javascript) into the visualization. server-side data-storage is rrd
Settings
For a general understanding of how the configuration files are structured and what elements and attributes are it is recommended to read this section first: Pages and structure of CometVisu.
The behaviour and appearance of the diagram plugins can be influenced by using certain attributes and elements. The following tables show the allowed attributes and elements and their possible values. The screenshots show, how both can be edited in the editor.
Attributes underlined by ..... are mandatory, all the others are optional and be omitted.
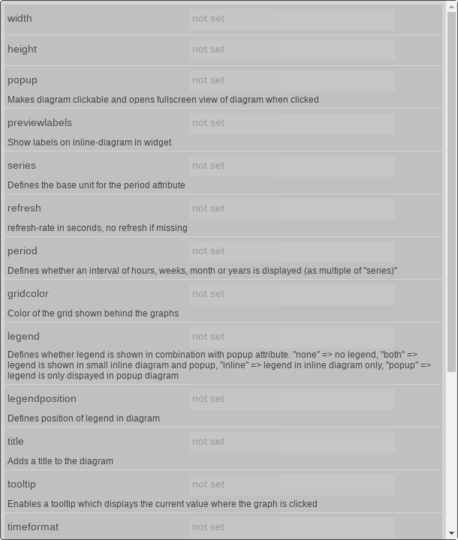
Allowed attributes in the diagram-element
| Element | Attribute | |||
|---|---|---|---|---|
| Name | Content | Description | ||
| diagram | width | dimenstion (number+unit) | ||
| height | dimenstion (number+unit) | |||
| popup | true or false | Makes diagram clickable and opens fullscreen view of diagram when clicked | ||
| previewlabels | true or false | Show labels on inline-diagram in widget | ||
| series | hour, day, week, month, year, fullday or custom | Defines the base unit for the period attribute | ||
| refresh | integer | refresh-rate in seconds, no refresh if missing | ||
| period | string | Defines whether an interval of hours, weeks, month or years is displayed (as multiple of “series)” | ||
| gridcolor | string | Color of the grid shown behind the graphs | ||
| legend | both, inline, popup or none | Defines whether legend is shown in combination with popup attribute. “none” => no legend, “both” => legend is shown in small inline diagram and popup, “inline” => legend in inline diagram only, “popup” => legend is only dispayed in popup diagram | ||
| legendposition | nw, ne, sw or se | Defines position of legend in diagram | ||
| title | string | Adds a title to the diagram | ||
| tooltip | true or false | Enables a tooltip which displays the current value where the graph is clicked | ||
| timeformat | string | Defines time format for x-axis | ||
| timeformatTooltip | string | Defines time format for displayed values if tooltip is used | ||
| zoomYAxis | true or false | Defines whether zoom acts on y-axis in addition to x-axis | ||
| seriesStart | string | In case series attribute is of type “custom” the value of this attribute is used for the start of the series. | ||
| seriesEnd | string | In case series attribute is of type “custom” the value of this attribute is used for the end of the series. | ||
| seriesResolution | integer | In case series attribute is of type “custom” the value of this attribute is used for the resolution of the series. | ||
Attributes in the editor (simple view) [1]
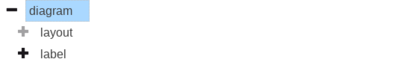
Allowed child-elements und their attributes
| Element | Attribute | |||
|---|---|---|---|---|
| Structure | Name | Content | Description | |
|
colspan | decimal | Amount of coloumns this widget sould be wide. | |
| colspan-m | decimal | Overrules the amount of coloumns on a medium screen. | ||
| colspan-s | decimal | Overrules the amount of coloumns on a small screen. | ||
| rowspan | decimal | Amount of rows this widget should be high. | ||
| x | string | Horizontal position of the widget for 2D pages. | ||
| x-s | string | Horizontal position of the widget for 2D pages on a small screen. | ||
| x-m | string | Horizontal position of the widget for 2D pages on a medium screen. | ||
| y | string | Vertical position of the widget for 2D pages. | ||
| y-s | string | Vertical position of the widget for 2D pages on a small screen. | ||
| y-m | string | Vertical position of the widget for 2D pages on a medium screen. | ||
| z | string | Reserved for future use. | ||
| width | string | Width for the widget for 2D pages. | ||
| width-s | string | Width for the widget for 2D pages on a small screen. | ||
| width-m | string | Width for the widget for 2D pages on a medium screen. | ||
| scale | true or false | Enable/Disable scaling layout values relative to backdrop on 2d pages (default: true). | ||
| scale-s | true or false | Enable/Disable scaling layout values relative to backdrop on 2d pages on a small screen (default: true). | ||
| scale-m | true or false | Enable/Disable scaling layout values relative to backdrop on 2d pages on a medium screen (default: true). | ||
| Element | Attribute | |||
|---|---|---|---|---|
| Structure | Name | Content | Description | |
|
name | string | ||
| type | string | |||
| flavour | string | Selection of a display variant. See also Flavour. | ||
| color | string | |||
| styling | string | Change the color of the dispayed value depending on its value. See also Styling | ||
| class | string | Add this value to the CSS class so that it can be formated by a user provided style sheet. | ||
|
string | Text to display a label for the widget. | ||
| Element | Attribute | |||
|---|---|---|---|---|
| Structure | Name | Content | Description | |
|
label | string | Defines the label of the axis | |
| min | decimal | Defines the minimum of y-axis. | ||
| max | decimal | Defines the maximum of y-axis. | ||
| position | left or right | |||
| unit | string | Defines the unit shown behind values in y-axis and tooltip | ||
| decimals | integer | Defines the number of digits in values of y-axis | ||
|
string | |||
| Element | Attribute | |||
|---|---|---|---|---|
| Structure | Name | Content | Description | |
|
yaxis | string | Assigns the rrd-data to a y-axis | |
| color | string | Defines the color of the data-line in the graph | ||
| label | string | Defines the label of the data-series in the legend | ||
| scaling | decimal | |||
| steps | true or false | |||
| fill | true or false | Fill the space below the data-series or bar | ||
| style | lines, bars or points | |||
| barWidth | integer | Width of the bars in units of the x axis, contrary to most other measures that are specified in pixels. For instance, for time series the unit is milliseconds so 24 * 60 * 60 * 1000 produces bars with the width of a day. | ||
| align | left, right or center | |||
| datasourceIndex | integer | If there are multiple datasources in the RRD file this index defines which one to show. Use “rrdtool info” to find the correct index. | ||
| consolidationFunction | AVERAGE, LAST, MIN or MAX | Choose one of the consolidation functions of the RRDTool (see http://rrdtool.org). | ||
| resolution | integer | The standard resolution for retrieving data from the RRD file can be overriden with a custom value in seconds. | ||
| offset | integer | An offset in seconds to modify the timestamp of the retrieved data from the RRD file. | ||
|
string | |||
| Element | Attribute | |||
|---|---|---|---|---|
| Structure | Name | Content | Description | |
|
measurement | string | Selection of the database and measurement (example: timeseries_db/KNX_LINE1) | |
| yaxis | string | Assigns the InfluxDB-data to a y-axis | ||
| color | string | Defines the color of the data-line in the graph | ||
| label | string | Defines the label of the data-series in the legend | ||
| scaling | decimal | |||
| steps | true or false | |||
| fill | true or false | Fill the space below the data-series or bar | ||
| style | lines, bars or points | |||
| barWidth | integer | Width of the bars in units of the x axis, contrary to most other measures that are specified in pixels. For instance, for time series the unit is milliseconds so 24 * 60 * 60 * 1000 produces bars with the width of a day. | ||
| align | left, right or center | |||
| authentication | string | When the InfluxDB requires authentication the credentials in the hidden config with this key will be used. | ||
| field | string | If there are multiple fields in the InfluxDB series this field defines which one to show. (When not set a default of “*” will be used.) | ||
| resolution | integer | The temporal resolution for the InfluxDB data can be set to a fixed interval (value in seconds). | ||
| consolidationFunction | COUNT, DERIVATIVE, DERIVATIVE_COUNT, DERIVATIVE_MEAN, DERIVATIVE_MEDIAN, DERIVATIVE_MODE, DERIVATIVE_SUM, DERIVATIVE_FIRST, DERIVATIVE_LAST, DERIVATIVE_MIN, DERIVATIVE_MAX, DERIVATIVE_PERCENTILE_1, DERIVATIVE_PERCENTILE_5, DERIVATIVE_PERCENTILE_10, DERIVATIVE_PERCENTILE_20, DERIVATIVE_PERCENTILE_25, DERIVATIVE_PERCENTILE_75, DERIVATIVE_PERCENTILE_80, DERIVATIVE_PERCENTILE_90, DERIVATIVE_PERCENTILE_95, DERIVATIVE_PERCENTILE_99, DIFFERENCE, DIFFERENCE_COUNT, DIFFERENCE_MEAN, DIFFERENCE_MEDIAN, DIFFERENCE_MODE, DIFFERENCE_SUM, DIFFERENCE_FIRST, DIFFERENCE_LAST, DIFFERENCE_MIN, DIFFERENCE_MAX, DIFFERENCE_PERCENTILE_1, DIFFERENCE_PERCENTILE_5, DIFFERENCE_PERCENTILE_10, DIFFERENCE_PERCENTILE_20, DIFFERENCE_PERCENTILE_25, DIFFERENCE_PERCENTILE_75, DIFFERENCE_PERCENTILE_80, DIFFERENCE_PERCENTILE_90, DIFFERENCE_PERCENTILE_95, DIFFERENCE_PERCENTILE_99, ELAPSED, INTEGRAL, MAX, MEAN, MEDIAN, MIN, MODE, SPREAD, STDDEV or SUM | Choose one of the available data aggregation functions - required when the “resolution” attribute is set. | ||
| fillMissing | string | Optional when attribute “resolution” is set: fill the time steps where data is missing by this value or one of “linear”, “none”, “null” or “previous”. | ||
| offset | integer | An offset in seconds to modify the displayed timestamps of the retrieved data from the InfluxDB. | ||
Elements in the editor
Examples
It is possible to manually edit the visu_config.xml and add an entry for the diagram plugin.
Caution
Make sure that you only use UTF-8 encoded characters by settings the encoding in your XML-editor to UTF-8 mode!
Footnotes
| [1] | The simple view might not show everything. To see all elements/attributes use the expert view. |