The diagram plugin
Description
This plugins integrates flot (diagrams in javascript) into the visualization. server-side data-storage is rrd
Settings
For a general understanding of how the configuration files are structured and what elements and attributes are it is recommended to read this section first: visu-config-details.
The behaviour and appearance of the diagram plugins can be influenced by using certain attributes and elements. The following tables show the allowed attributes and elements and their possible values. The screenshots show, how both can be edited in the editor.
Attributes underlined by ..... are mandatory, all the others are optional and be omitted.
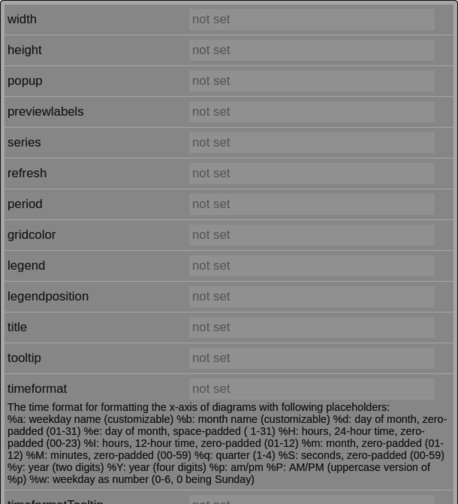
Allowed attributes in the diagram-element
| Element | Attribute | |||
|---|---|---|---|---|
| Name | Content | Description | ||
| diagram | width | dimenstion (number+unit) | ||
| height | dimenstion (number+unit) | |||
| popup | true or false | |||
| previewlabels | true or false | |||
| series | hour, day, week, month, year, fullday or custom | |||
| refresh | integer | |||
| period | string | |||
| gridcolor | string | |||
| legend | both, inline, popup or none | |||
| legendposition | nw, ne, sw or se | |||
| title | string | |||
| tooltip | true or false | |||
| timeformat | string | The time format for formatting the x-axis of diagrams with following placeholders:<br/> %a: weekday name (customizable) %b: month name (customizable) %d: day of month, zero-padded (01-31) %e: day of month, space-padded ( 1-31) %H: hours, 24-hour time, zero-padded (00-23) %I: hours, 12-hour time, zero-padded (01-12) %m: month, zero-padded (01-12) %M: minutes, zero-padded (00-59) %q: quarter (1-4) %S: seconds, zero-padded (00-59) %y: year (two digits) %Y: year (four digits) %p: am/pm %P: AM/PM (uppercase version of %p) %w: weekday as number (0-6, 0 being Sunday) | ||
| timeformatTooltip | string | The time format for formatting the tooltip’s time value. See timeformat attribute for possible values | ||
| zoomYAxis | true or false | |||
| seriesStart | string | In case series attribute is of type “custom” the value of this attribute is used for the start of the series. | ||
| seriesEnd | string | In case series attribute is of type “custom” the value of this attribute is used for the end of the series. | ||
| seriesResolution | integer | In case series attribute is of type “custom” the value of this attribute is used for the resolution of the series. | ||
Attributes in the editor (simple view) [1]
Allowed child-elements und their attributes
| Element | Attribute | |||
|---|---|---|---|---|
| Structure | Name | Content | Description | |
|
colspan | decimal | Amount of coloumns this widget sould be wide. | |
| colspan-m | decimal | Overrules the amount of coloumns on a medium screen. | ||
| colspan-s | decimal | Overrules the amount of coloumns on a small screen. | ||
| rowspan | decimal | Amount of rows this widget should be high. | ||
| x | string | Horizontal position of the widget for 2D pages. | ||
| y | string | Vertical position of the widget for 2D pages. | ||
| z | string | Reserved for future use. | ||
| width | string | Width for the widget for 2D pages. | ||
| Element | Attribute | |||
|---|---|---|---|---|
| Structure | Name | Content | Description | |
|
name | string | ||
| type | string | |||
| flavour | string | Selection of a display variant. See also :ref:’flavour’. | ||
| color | string | |||
| styling | string | |||
| class | string | Add this value to the CSS class so that it can be formated by a user provided style sheet. | ||
|
string | Text to display a label for the widget. | ||
| Element | Attribute | |||
|---|---|---|---|---|
| Structure | Name | Content | Description | |
|
label | string | ||
| min | decimal | |||
| max | decimal | |||
| position | left or right | |||
| unit | string | |||
| decimals | integer | |||
|
string | |||
| Element | Attribute | |||
|---|---|---|---|---|
| Structure | Name | Content | Description | |
|
yaxis | string | ||
| color | string | |||
| label | string | |||
| scaling | decimal | |||
| steps | true or false | |||
| fill | true or false | |||
| style | lines, bars or points | |||
| barWidth | integer | Width of the bars in units of the x axis, contrary to most other measures that are specified in pixels. For instance, for time series the unit is milliseconds so 24 * 60 * 60 * 1000 produces bars with the width of a day. | ||
| align | left, right or center | |||
| datasourceIndex | integer | If there are multiple datasources in the RRD file this index defines which one to show. Use “rrdtool info” to find the correct index. | ||
| consolidationFunction | AVERAGE, LAST, MIN or MAX | |||
| resolution | integer | The standard resolution for retrieving data from the RRD file can be overriden with a custom value in seconds. | ||
| offset | integer | An offset in seconds to modify the timestamp of the retrieved data from the RRD file. | ||
|
string | |||
Examples
It is possible to manually edit the visu_config.xml and add an entry for the diagram plugin.
Caution
Make sure that you only use UTF-8 encoded characters by settings the encoding in your XML-editor to UTF-8 mode!
Footnotes
| [1] | The simple view might not show everything. To see all elements/attributes use the expert view. |